
Butterfly monitoring scheme
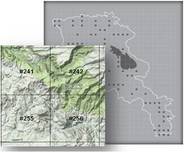
Since 2003 new methods have been employed for butterfly surveys and monitoring. The European Monitoring Grid (1996) was applied for the territory of the republic that was divided the area into 374 squares, 10x10 km each. Further, the squares were divided into two groups. The first group was consisting of squares, where the monitoring was conducted, and they belong to several categories, including squares placed in the existing protected areas and squares located in close vicinity of protected areas where agricultural or industrial activities were implemented (it allows comparison of the habitats inside protected areas with the ones which have been influenced by human). Third category of squares where monitoring was conducted were sites, which have been detected founded on floristic ranging of A.L. Takhtajan (1949), based on assumption that the diversity of plants is important in determining the diversity of butterfly species.
In the second group of squares monitoring was not conducted: due to lack of resources or physical impossibility.
Usually, the squares themselves were not uniform: in a single square one could find several natural habitats, so for full coverage of the square, we laid on one route for each habitat. Thus, the number of routes in one square was varied from one to three. The frequency of counts on each route was determined by duration of the spring and summer seasons, and depending on the height was ranged from one to four times a year.
|
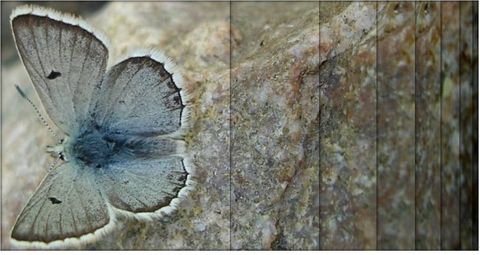
For the surveys, we have selected a standardized transect counting method better known as Pollard Walk (Pollard 1984, Pollard & Yates 1993). To this end, we have selected squares were the routes for regular data collection have been laid. Each route itself forms the strip with length from 300 to 500 m (depending on the degree of homogeneity of the habitat), width of 2.5 m on each side; it was located as far from the periphery of the biotope as possible to avoid edge effect. Routes were laid parallel to the slope and possibly away from the roads. Surveys have been carried out by us, in the clear days in the interval from 11:00 to 15:00, when the air temperature was above 17°C and wind speed was less than 3 m/sec. To record the count data, we have used standard protocols. At the beginning of the route we recorded the geographic coordinates of the starting point, weather conditions, type of habitat, the names of counters and the start time of count. During the walking through the route, we have been recording observed butterfly species and their number, ignoring the specimens which have been observed outside the five meters width of the route. At the end of the route we have been recording the geographical coordinates of the end point, the end time and traces of human activity in the area.
Until 2008 we have been using taxonomy and systematics of the butterflies based on Tuzov et al. (1997, 2003) and Hasselbarth et al. (1995) and later have corrected it according to Encyclopedia of Life (eol.species.list). In index on habitats we have been using classification of A.L. Takhtadjyan (1949), which later was transferred into habitat classification scheme used by IUCN (see IUCN: Habitats Classification Scheme version 3.0); index of threats was based on the classification of IUCN (IUCN threat classification scheme). Database interface contains a list of all of the above mentioned parameters; and the assembly was implemented on the platform of Access. 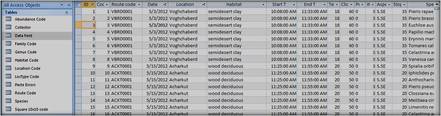
|
|
Distribution and population
For the study of
distribution and abundance of butterflies the data collected from 2003 to 2013
with the same methodology was used. Taking into account the fact that the
number of butterflies was counted on routes of different lengths, for their unification
a number per 1 km of route was
computed according to the formula
N1km = 1000*(n/Lroute), where N1km is a number of butterflies per 1 km of the route, n is a number per route, and Lroute is a length of the route.
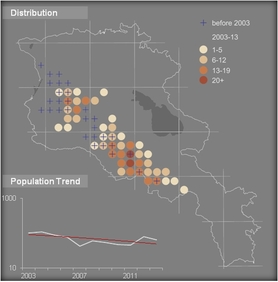
To visualize the species distribution we have computed waited mean of N1km for 2003-2013 (Nwmean), after that using ArcGIS 10.1 we have created a linear shape file for each species, where by coordinates of the start and end points of the route the lines have been outlined; the lines have had a value of Nwmean in the attribute table for each route. With the next step we have created a point shape file, where the point was constructed in the 10x10 km square, and was uniting 1-3 routes. Coordinates of the point have been taken as the central coordinates of the square and the average of values of Nwmean was calculated. Since abundance of a species can vary within a range a necessity of better demonstration of the uneven population pattern emerged. For the purpose the values of Nwmean have been conditionally grouped into the following categories: 1-5; 6-12; 13-19, and over 20. Those categories received different colors and that allows visualizing the nonuniform number of the species on the map.
Information on the species distribution was supplemented by historical records, which have not been uniformly collected though. Thus the material (including collections) until 1995 was tied to the geographic locations, while later registrations – since 1996 have had GPS coordinates. These registrations were not а subject to quantitative analysis, but were transferred to GIS format and reflected on the distribution maps. To compute and visualize the population trend we have used Collated Index taken in a logarithmic scale, which was calculated using N1km with use of the TRIM 3.0 software. For statistical analysis the log-linear poison regression was used: at first the mean Collated Index was calculated for the period of 2003-2013, and then, each year was receiving an index, depending on level of difference from the mean Collated Index. The obtained graph was used to calculate the trend and percentage of decrease or increase of the population, significance was considered at p<0.05 level.
N1km = 1000*(n/Lroute), where N1km is a number of butterflies per 1 km of the route, n is a number per route, and Lroute is a length of the route.
To visualize the species distribution we have computed waited mean of N1km for 2003-2013 (Nwmean), after that using ArcGIS 10.1 we have created a linear shape file for each species, where by coordinates of the start and end points of the route the lines have been outlined; the lines have had a value of Nwmean in the attribute table for each route. With the next step we have created a point shape file, where the point was constructed in the 10x10 km square, and was uniting 1-3 routes. Coordinates of the point have been taken as the central coordinates of the square and the average of values of Nwmean was calculated. Since abundance of a species can vary within a range a necessity of better demonstration of the uneven population pattern emerged. For the purpose the values of Nwmean have been conditionally grouped into the following categories: 1-5; 6-12; 13-19, and over 20. Those categories received different colors and that allows visualizing the nonuniform number of the species on the map.
Information on the species distribution was supplemented by historical records, which have not been uniformly collected though. Thus the material (including collections) until 1995 was tied to the geographic locations, while later registrations – since 1996 have had GPS coordinates. These registrations were not а subject to quantitative analysis, but were transferred to GIS format and reflected on the distribution maps. To compute and visualize the population trend we have used Collated Index taken in a logarithmic scale, which was calculated using N1km with use of the TRIM 3.0 software. For statistical analysis the log-linear poison regression was used: at first the mean Collated Index was calculated for the period of 2003-2013, and then, each year was receiving an index, depending on level of difference from the mean Collated Index. The obtained graph was used to calculate the trend and percentage of decrease or increase of the population, significance was considered at p<0.05 level.
|
As it was shown by the works conducted in a number of European countries, butterflies are an effective tool for monitoring of terrestrial ecosystems since they are extremely sensitive indicators of changes. If existence of long-term data series allows, they can be used not only for detection of patterns of changes occurring in habitats, but also for prediction of those (The Millennium Atlas, The State of Butterflies in Britain and Ireland). Taking this into account, we are assisting to lay the tradition of regular monitoring of butterflies, as an important tool for the rational use of the natural resources; the intermediate summarizing of our efforts will be an Atlas Book "The State of Butterflies in Armenia".
|
Species conservation status
To assess the
conservation status of species the last manual of IUCN (2012) Guidelines for
Application of IUCN Red List Criteria at Regional and National Levels: Version
4.0 was taken as a basis, which was used together with more general guidance:
IUCN Red List Categories and Criteria: Version 3.1. According to the
Guidelines, to determine the status of the species we estimated population of
the species and its habitat in the territory of Armenia, the population trend over 10 years, the risk of disappearance of
habitat, the degree of specialization of the form, the degree of endemicity and its
representation in national and international documents and regulations.
Initial information
needed to assess the conservation status is set out in species accounts,
particularly in the section Distribution and biological peculiarities we present its
distribution in the world, occupied habitat, flight period, the
stage of hibernation and host plant in Armenia; section Population
dynamics refers to the
number of species, its dynamics and existing or potential threats (section is
illustrated with map showing the change in the population throughout the range,
and the graph that shows the change in the number for the period 2003-2013);
section Conservation
measures states the measures
that are necessary for the protection of a species and its habitat or requires
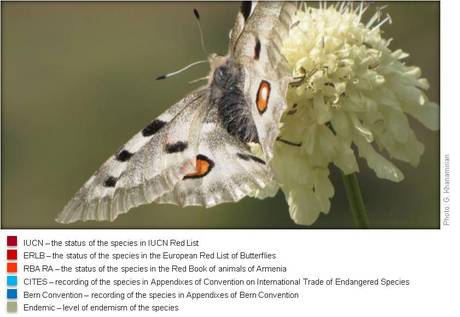
further study. Species accounts are complemented by the status of the species at
the national, regional and international levels, as symbols at the right demonstrate. The
conducted assessments of the status of threatened species in Armenia, but not
yet included in the Red Book of Animals of Armenia are planned for submission to the Ministry of
Nature Protection of the Republic of Armenia, and assessments of the species that are at risk of global
extinction, but have not been evaluated internationally are planned for
submission to the IUCN Species Survival Commission.
Area assessment and promotion
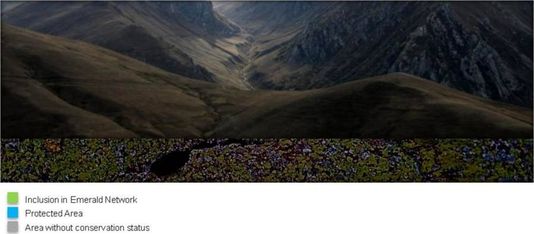
The area assessment is based on monitoring data (collected in the period 2003-2013), supplemented by data for the period 1993-2002, the latter have been used to generate species lists for the areas. Further the target species have been separated (van Swaay & Warren 2006), and the species diversity characteristics, including number of endemics of the region have been identified. Based of these two components, the decision about fitting the territory with the criteria of PBA was made. Then each area was presented in the following sequence: description of the territory, which included the geographical coordinates of the central point, elevation range, area, main habitats (IUCN: Habitats Classification Scheme version 3.0), the dominating plant species and general information about the climate; description of the fauna of butterflies, which included information on the species diversity and lists of target species and endemics; description of the threats, which included types of the land use in these areas, existing and potential threats arising from human activities (IUCN: Unified Classification of Direct Threats version 3.2); national or international protection status, which was denoted with the following symbols (see picture).
The current information was presented to Butterfly Conservation Europe for approval and inclusion of the PBA into the general database. The information that was collected to assess the status of the territory as a PBA was also used for popularization and promotion of the site for butterfly-watching, becoming in fact the basis for designing of tourist trails. Based on that, the information materials were developed, such as trail-guides and information boards, which have been complementing the existing infrastructure of protected areas (Lake Arpi National Park). The next step is a training of rangers of protected areas in species identification and guiding of tourists on a given trail. Along with this, we conduct lectures and excursions with local students, during which the specificity of the local fauna was emphasized giving it a character of exclusivity, and motivating the younger generation to be responsible for the species and their habitats. Promotion of the territories is finalized with the actions aimed at disseminating information about the opportunities of butterfly watching (Track Arevik National Park) among local tour operators which have wildlife tour packages. In addition to these actions, efforts in developing the infrastructure (such as Information and Accommodation Centers) were started in 2016 with the pilot project "Development of Butterfly-watching in Gnishik community-managed protected area".
The current information was presented to Butterfly Conservation Europe for approval and inclusion of the PBA into the general database. The information that was collected to assess the status of the territory as a PBA was also used for popularization and promotion of the site for butterfly-watching, becoming in fact the basis for designing of tourist trails. Based on that, the information materials were developed, such as trail-guides and information boards, which have been complementing the existing infrastructure of protected areas (Lake Arpi National Park). The next step is a training of rangers of protected areas in species identification and guiding of tourists on a given trail. Along with this, we conduct lectures and excursions with local students, during which the specificity of the local fauna was emphasized giving it a character of exclusivity, and motivating the younger generation to be responsible for the species and their habitats. Promotion of the territories is finalized with the actions aimed at disseminating information about the opportunities of butterfly watching (Track Arevik National Park) among local tour operators which have wildlife tour packages. In addition to these actions, efforts in developing the infrastructure (such as Information and Accommodation Centers) were started in 2016 with the pilot project "Development of Butterfly-watching in Gnishik community-managed protected area".
Conservation educationTo secure sustainability in the use of natural resources and in species and habitat conservation it is very important to educate the young generation. For developing of children interest in nature the visible bright objects are commonly used, and the butterflies are a good example of that. Studies have shown that a person's attitude to the subject changes with the advent of the object‘s name.
The youths, who learns to recognize species of butterflies are gradually changing their attitude towards them: it becomes personal and therefore more careful. Thus, the development of tools to teach identifications of butterfly species was for us both responsible and interesting task. The developed training has been repeatedly tested on different age groups, have proved their effectiveness in the development of species identification skills, while excursions to the nature have been enhancing the effect, allowing our trainees to test their knowledge in the real conditions. Feedback of trainees who passed the course showed that the impulse that they had, contributed to the formation of a personal relationship with nature. |
|
